Why the Key Process Flow Map is critical to your strategic execution.
Aug 25, 2020
In early 2021 the 3HAG Community changed the name of the tool previously called the Key Process Flow Map (KPFM) to the Key Function Flow Map (KFFM). I have updated this article to reflect this with the exception of the article title as this would break the links to this page. - March 2021.
One of the tools I have used with my clients for the last few years is the Key Function Flow Map (from “The 3HAG Way”). It is quite a simple tool but most people don’t realise how powerful it is. It is fundamental to achieving what you want from your business. To many people it looks like a trivial process flow map and, in its simplest form that is exactly what it is. But it can very easily very much more: it can be the map of your business, of the problems in your business and, very importantly, how money gets into your company bank account.
When I have stressed this important concept some people have said to me “well business is not just about the money!” which is absolutely correct but see how long you last with no money in the bank and I’d love to hear about your business growth if you had no cash in the bank; growth as we know, sucks cash.
What we are most concerned with are the key functions that directly contribute to getting cash in your company bank account; real dollars, pounds (or whatever currency you use). So what about HR, IT, M&A et cetera? Yes, these are critically important but do not directly result in dollars in your bank account. This doesn't mean that you disregard them, not at all, it just means they are not part of the direct money flow process to your bank account. If you really want, put them along the bottom of your KFFM, I'll show an example of that later in this article.
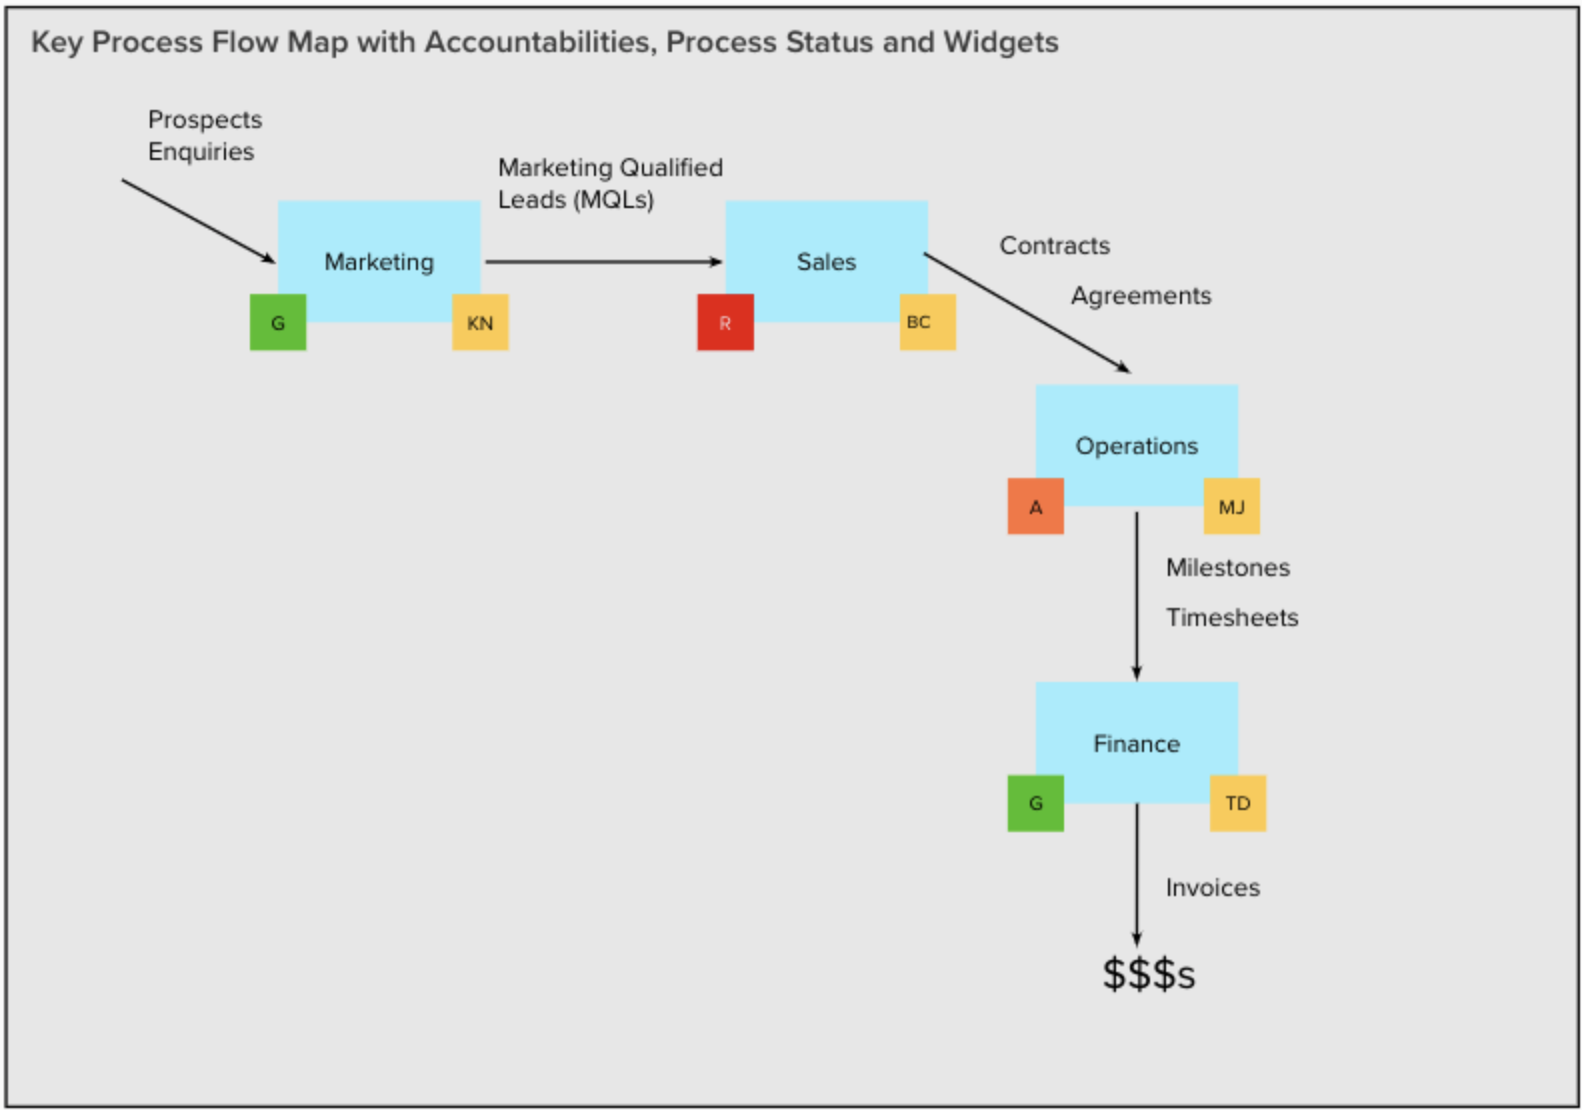
So, in its simplest form, this is what a KFFM looks like this.

So What? Well you would not believe the debate I have have seen on even the basic process flow within businesses. As a starting point, getting alignment within the leadership team on this basic process flow is worthwhile.
Accountability
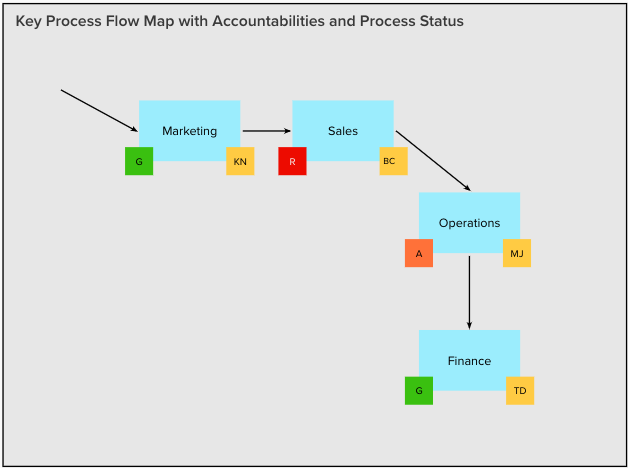
Where it becomes really powerful is when we start overlaying other information onto the KFFM. I start by taking the accountabilities from the Function Chart and overlaying them onto the KFFM. Now we know who is accountable for which key functions in the business.

Function Operational Status
Now lets overlay the status of each of the functions. I use a simple Red, Amber, Green indicators of status. Green means that everything is ticking along smoothly, Amber means that there are some issues that need to be addressed, Red means that there are some serious issues that need to be addressed. You can use your own system just as long as everyone agrees and understands what they mean. Incidentally, this is where you often start to see dysfunction in the leadership team starting to emerge, function owners not facing the brutal facts of how the the functions they are accountable for are running even when it is blatantly clear to everyone else in the leadership team. I'll talk about that issue in a separate article.

Now what is that telling us? Well in isolation, we could say that Sales is in trouble and Ops is experiencing some issues. We could expect from this picture that we should be focusing on these two areas if we want to scale. When we set our next set of quarterly priorities, if there was nothing planned to address either of these two processes I would be asking some questions of the leadership team.
We also need to look at the overall flow itself, if we fix Sales, then it is highly likely that Operations will then go red, and if Operations goes Red, then Finance's ability to invoice and collect effectively will also likely be impacted. So fixing one problem has moved the issue to another part of the Key Function Flow Map.
It is rare to see a Key Function Flow Map that is all green, in fact I don't think I have ever seen a KFFM that is all green (well not with a functional leadership team).
Metrics/Widgets
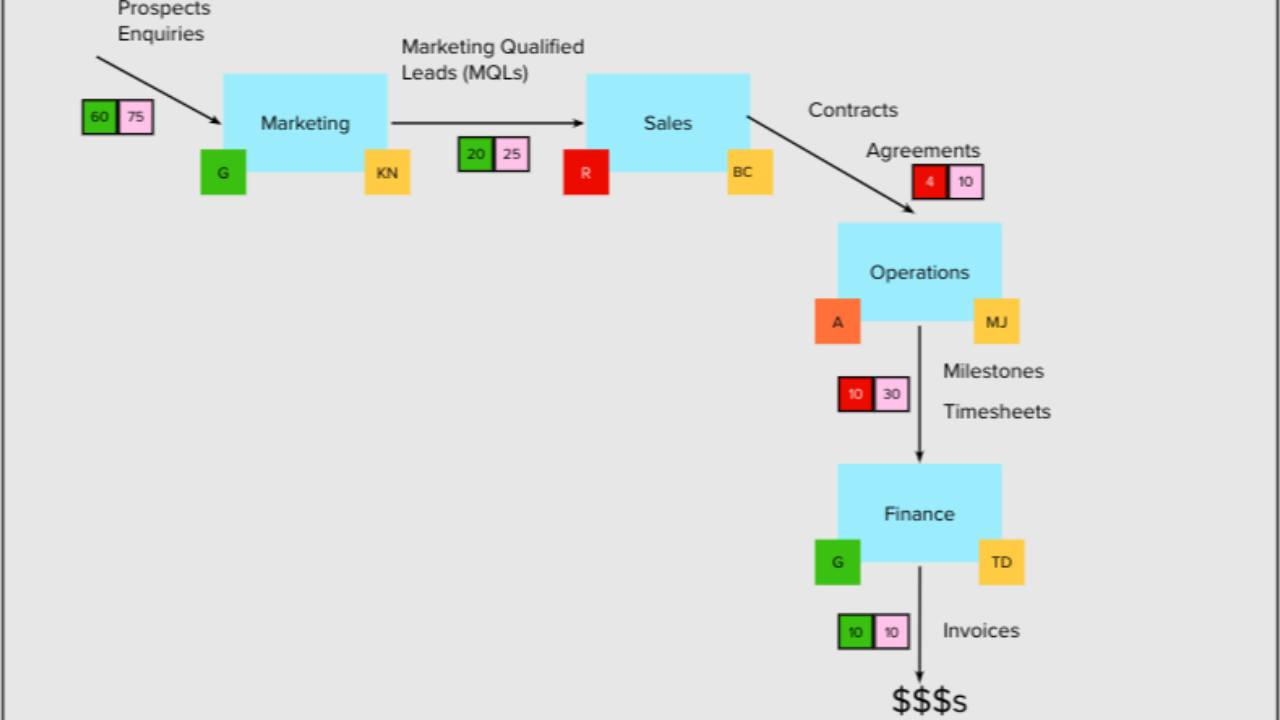
Now let's look at what flows through these functions. Each function will have some inputs and some outputs and these are normally things that can be measured. Once measured, we can use this data as leading indicators (for things flowing into a process) and as lagging indicators (for things flowing out of a process). Also bear in mind that something flowing out of a function will normally flow into the next process so what is a lagging indicator for one process is normally a leading indicator for the next process in the flow.

From this picture, we have a very clear view of what we should be measuring as we track to wards our monthly, quarterly, annual goals along the way to our 3HAG.
We can also over lay the numbers for these widgets on the Key Function Flow Map which now gives us a dashboard into the operation of our business.

Adding Other Functions to the Map
Although the Key Function Flow Map is primarily intended to show how money flows into your bank account, you can also add in the processes that are not DIRECTLY involved in this money flow process. I often put them at the bottom of the map along with their own accountabilities and their own status.

Another key insight that the KFFM can reveal is what is your true (and current) Profit/X. Nearly always, the "X" in your Profit per X is what falls out of sales. If this is not the X you want it to be, then you had better have a plan in place to pivot or restructure your business to bring it back in line. This will be the topic of a very different article.
And What Else?
I have overlaid other dimensions of information and data onto the Key Function Flow Map. Some of these are listed below and I am sure you can work out how to do this for yourselves.
- Average time to process (for each function). This gives you a view on how long it take a dollar to move through your business to convert into profit. The faster you can move things through your operational process, the quicker you can translate dollars into profit to re-invest in growth.
- Future Process Status. Some of my clients predict the status of their key functions (Red, Amber, Green) in 6 months or 12 months from now based on their 12 months plans and swimlanes. The use this view to guide their investment decisions as growth can often force a function into stress. Having a forward looking view helps determine where and when we need to invest to increase capacity.
- Capacity. Following on from the previous point, identifying the notional maximum (no stress) capacity for a function helps identify where you can move resources from and to as work moves through your business. I generally work on keeping capacity between 60% to 80% theoretical maximum capacity, anything below 60% is a waste of money and resources and anything above 80% starts to stress the process and create errors and rework.
- Priorities. Overlaying your quarterly and annual priorities onto the Key Function Flow Map shows where your focus will (should) be over the next 90 days and over the current year. If you have red or orange functions and none of your priorities are aimed at fixing this, you might want to look at where your focus is.
- Differentiators. There isn't always a clear 1-2-1 mapping between a process and a differentiator but identifying where the differentiators reside can sometimes be useful.
How do you use the Key Function Flow Map?
I encourage clients to keep their key function flow map up to date with their metrics, statuses (and other dimensions of information/data that are useful to them) and up on the wall in their war room. If they don't have a war room then I try to get them to have the KFFM to hand wherever the leadership team hold their daily huddle. Keeping this view front of mind helps keep metrics, priorities and focus alive in the day to day business operations that are critical to rapid growth with ease.
What's Next?
My next article shows you how to go from your differentiators to your 3 Year Quarter over Quarter Swimlane view of your roadmap and will focus on how to keep this view strategic rather than operational/tactical.
This article is one of a series of articles derived from Shannon Susko's work in "The 3HAG Way" the Strategic Execution system I use with my clients to get them what they want from their business with ease, speed and confidence. Get in touch if you need support to implement this tool or any of the other tools in the Scaling Up/3HAG toolkit.

